Employee Engagement Survey
The University of Arkansas’ Employee Engagement Survey gathers confidential employee feedback to support our efforts in strengthening the campus as an employer of choice. Working with McLean & Company, the university releases campus-wide results in addition to division and college level results being shared within units.
The results shared below are only the beginning. The true value of the Employee Engagement Survey comes through action planning (what leaders do with the insights gained). Across the university, leaders are using these results to create action plans that reflect the unique needs of their colleges, units and divisions. For example, an area that identifies career advancement and development as a priority may launch a recurring lunch-and-learn series designed to strengthen skills and support long-term growth. As these action plans take shape throughout 2026, this webpage will showcase examples of how leaders are turning 2025 survey feedback into meaningful action.
I want to thank everyone who completed the survey, the results are helping identify our strengths as a campus as well as areas for growth.
— Chancellor Charles Robinson
2025 Engagement Survey Results
The information below summarizes university‑level findings from the Fall 2025 survey, including all 13 engagement driver scores, the overall employee experience score and a priority matrix. Many of the results are measured against McLean's educational services benchmark that includes other universities, colleges, and schools who utilize the same survey tool. These results are grounded in feedback from more than 2,000 employees and are being used by university, divisional and college leaders to guide action planning, inform decision‑making and support ongoing efforts to strengthen the employee experience across campus.
Respondents by Role
Overall Engagement
The employee engagement results are determined from a set of 11 questions that examine discretionary effort levels and connection to the organization. An employee’s average score across these questions determines their level of engagement. Engaged employees feel energized, passionate, and dedicated. They are highly involved with their work and the organization.
Employee Experience
The employee experience score measures how likely an employee is to recommend the University of Arkansas as an employer to other qualified individuals, similar to a net promoter score.
This score can range from -100 to 100, with a positive score indicating more employees would recommend the university than would not. This measure is based off a single question on a 0 to 10 scale with those answering 9 or 10 being supporters, 7 or 8 being passive, and 6 or below being detractors. The final score is then calculated by subtracting your percentage of supporters from your percentage of detractors.
Question: How likely would you be to recommend this University to a qualified friend or a family member as a great place to work?
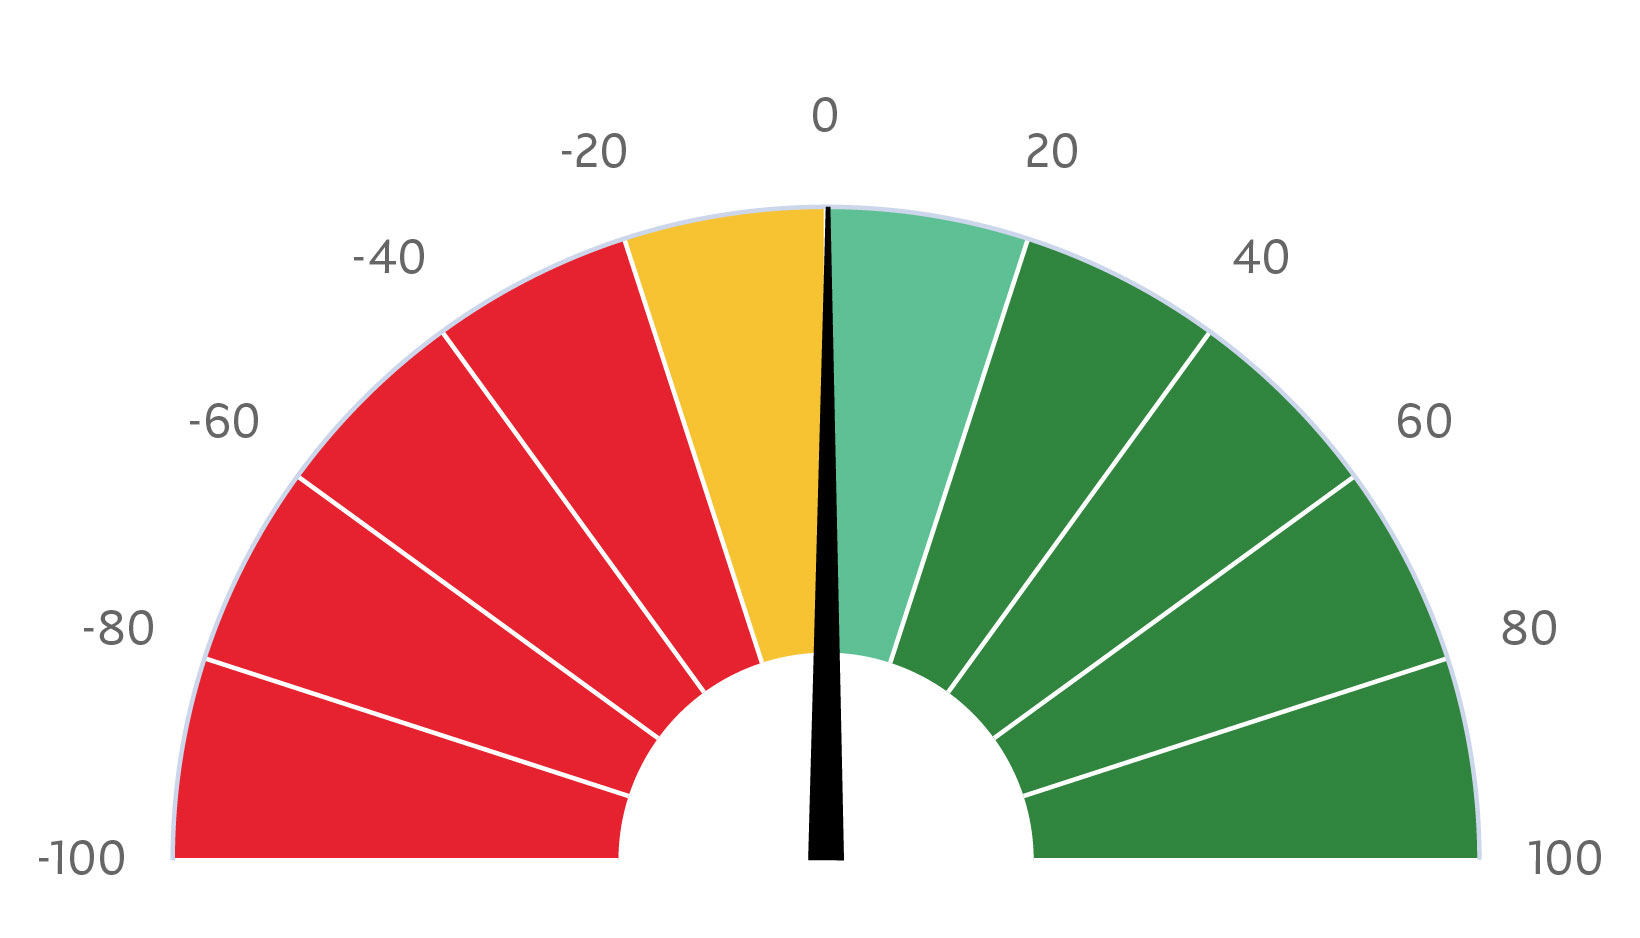
CURRENT SCORE
0.2
AVERAGE RESPONSE
7
BENCHMARK
3.6
Score Breakdown
Trending Questions
Engagement Drivers
In addition to the 11 questions used to measure engagement, 13 engagement and retention drivers were assessed. These drivers represent factors that influence overall employee engagement and provide insight into where improvements may have the greatest impact. Below, each driver is ranked from highest performing to lowest performing across the University of Arkansas.
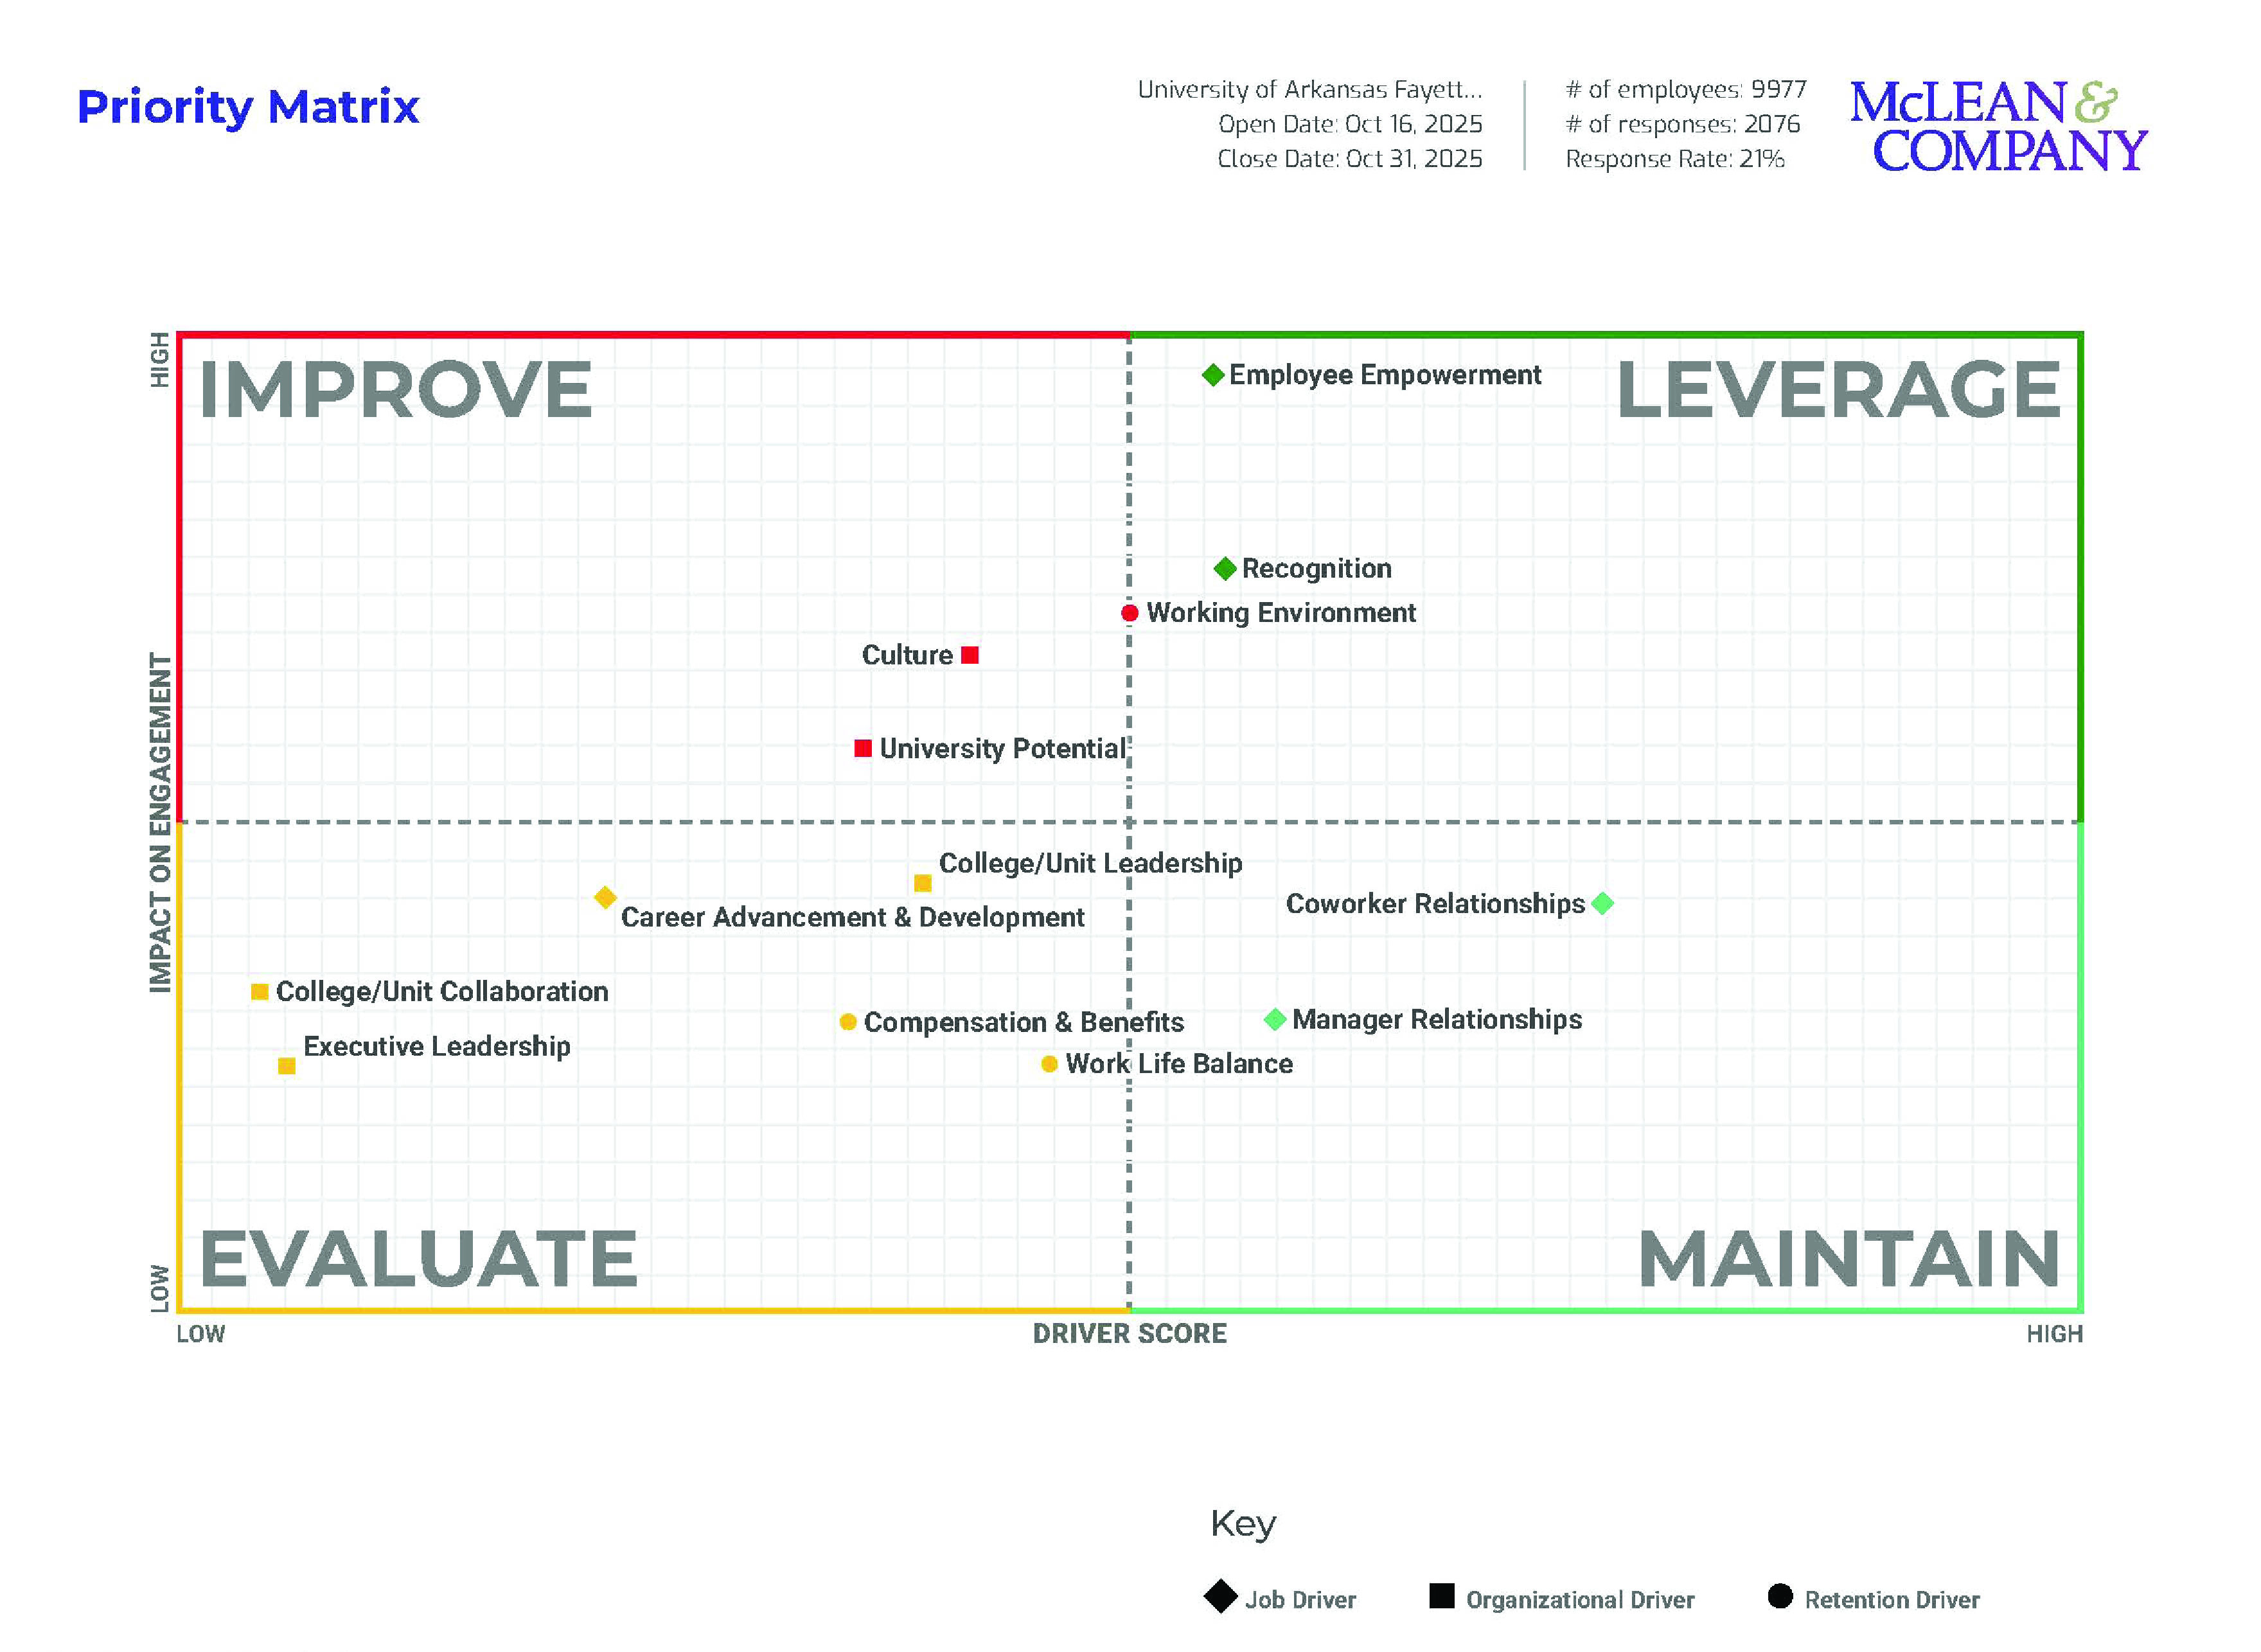
Priority Matrix
McLean and Company provide a priority matrix that shows the relationships between individual driver scores and their impact on overall engagement. Each quadrant helps leaders visually identify areas of strength as well as areas that may warrant closer examination or focused action.

Employer of Choice
This initative began under the 150 Forward Employer of Choice Strategic Pillar.